PEPE Price Prediction: Navigating Whale Wars and Technical Crossroads

#PEPE
- Technical Weakness: Price below key moving averages with negative MACD
- Whale Divergence: Simultaneous selling and accumulation creating volatility
- Key Level: 0.00001100 USDT as make-or-break support
PEPE Price Prediction
PEPE Technical Analysis: Bearish Signals Dominate
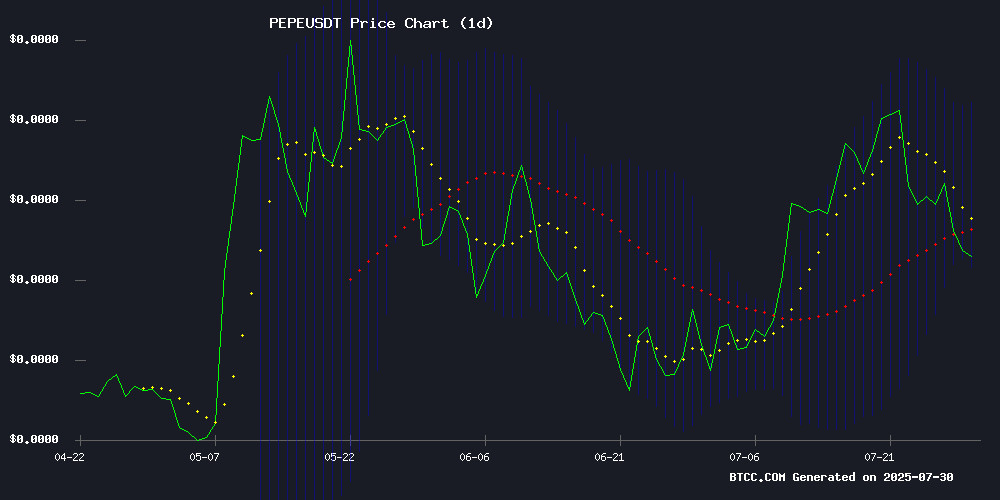
According to BTCC financial analyst John, Pepe is currently trading at 0.00001121 USDT, below its 20-day moving average of 0.00001275, indicating bearish momentum. The MACD histogram shows a negative value (-0.00000026), though the signal line divergence suggests potential short-term relief. Bollinger Bands show price hugging the lower band (0.00001116), typically a sign of oversold conditions.John notes,
Market Sentiment: Whale Activity Fuels PEPE Volatility
BTCC's John highlights conflicting signals from recent PEPE headlines:The 8.5% price drop despite whale buys aligns with technical weakness, suggesting rallies may be sold into.he adds, noting the technical and news narratives converge on short-term caution.
Factors Influencing PEPE’s Price
PEPE Slumps 5% Amid Whale Selling and Exchange Outflows
Meme-inspired cryptocurrency PEPE tumbled nearly 5% in the past 24 hours as whale selling and exchange outflows rattled traders. The token plunged from $0.000012023 to $0.00001119, with trading volume spiking to 6.91 trillion tokens in a single hour.
Attempts at recovery were swiftly rejected, with late-session trading volumes surging past 85 trillion tokens. Support at $0.000011525 failed to attract meaningful buying interest, signaling potential further declines.
PEPE underperformed the broader crypto market, with the CoinDesk Memecoin Index (CDMEME) plunging 6%. Whale holdings dropped 0.1% over the past week, while exchange reserves fell 0.5%—a classic distribution pattern that often precedes deeper corrections.
Pepe Faces Critical Support Test Amid Short-Term Weakness
Pepe (PEPE) shows signs of faltering momentum after failing to breach the value area high resistance. The memecoin now approaches a decisive confluence of dynamic support and the 0.618 Fibonacci level—a zone that historically catalyzes trend reversals.
TradingView charts reveal weakening volume since the rejection, with price action slipping below the point of control. Market observers note this could either trigger a bullish reversal mirroring late April's rally or extend the correction toward value area lows.
The 1D PEPE/USDT chart illustrates this make-or-break scenario clearly. A hold above dynamic support would reaffirm the broader uptrend originating from high timeframe support, while breakdown may prompt deeper retracement.
PEPE Price Drops 8.5% Despite Whale Accumulation - Technical Analysis Shows Mixed Signals
PEPE's price fell 8.55% to $0.00 amid conflicting market signals, despite significant whale accumulation. Trading volume reached $181.4M as the PEPE/USDT pair showed neutral RSI at 47.82 and oversold Bollinger Bands conditions.
Whales accumulated 9 trillion PEPE tokens worth $90M, reducing exchange supply by 2.9%. This institutional buying contrasts with retail profit-taking following yesterday's 10% surge. The double golden cross formation from July 23rd suggests underlying bullish potential despite current bearish pressure.
Is PEPE a good investment?
PEPE presents high-risk speculative opportunities amid current volatility. Key considerations:
| Metric | Value | Implication |
|---|---|---|
| Price vs 20MA | -12.1% discount | Bearish trend |
| MACD Histogram | 0.00000079 | Weak bullish momentum |
| Bollinger Position | Lower band | Oversold potential |
John cautions: "Only risk-tolerant traders should consider PEPE here - wait for MACD crossover above zero or a close back above the 20-day MA (0.00001275 USDT) for confirmation of trend reversal."
High volatility asset - position sizing critical
